Analyzing the Performance of Premier League's Top 10 Midfielders with Radar Charts
作者:网站小编文章来源: 发布日期:2024-02-12 07:25:04
Recently, I have been compiling player data from Wyscout and using radar charts to analyze their performances. Previously, I compared midfielders like Havertz, Grealish, and Maddison. This time, I wanted to directly compare the top 10 midfielders from the Premier League using radar charts.
Before we proceed, there are a few points that need to be emphasized:
- The top 10 Premier League teams include Arsenal, Aston Villa, Brighton, Chelsea, Liverpool, Manchester City, Manchester United, Newcastle, Tottenham, and West Ham.
- The selection of midfielders is based on players who have played in the midfield position according to Wyscout's definition. Additionally, players must have played at least 900 minutes and be considered regular starters based on specific team criteria.
- The data is based on Wyscout's statistics, but I have made further calculations based on my own understanding.
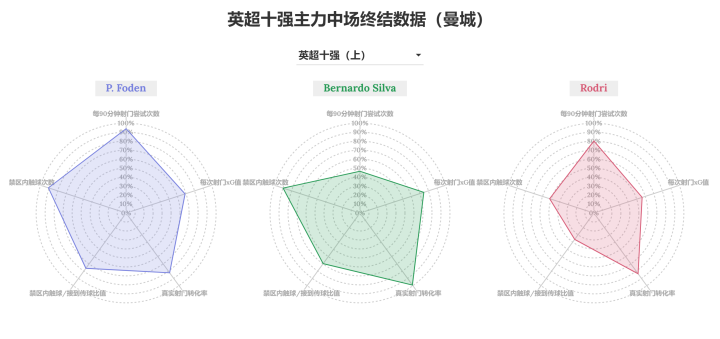
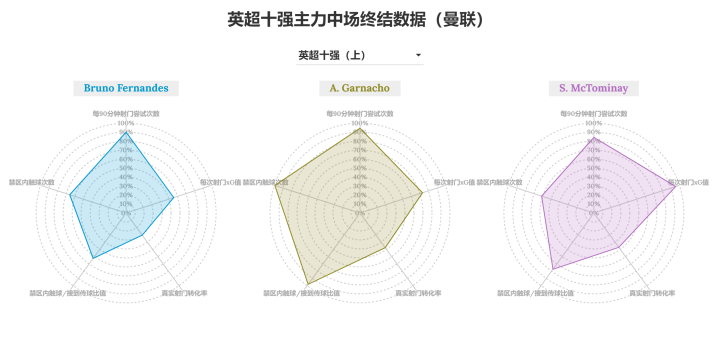
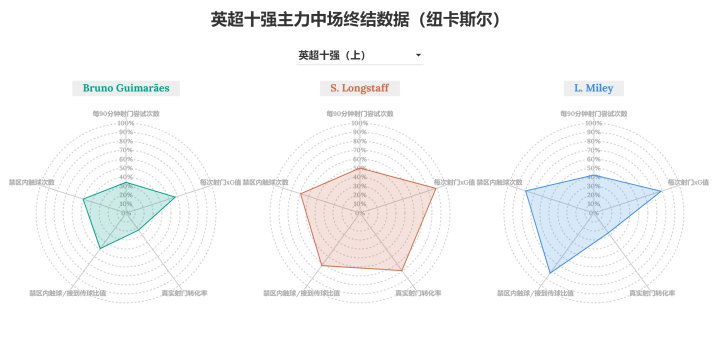
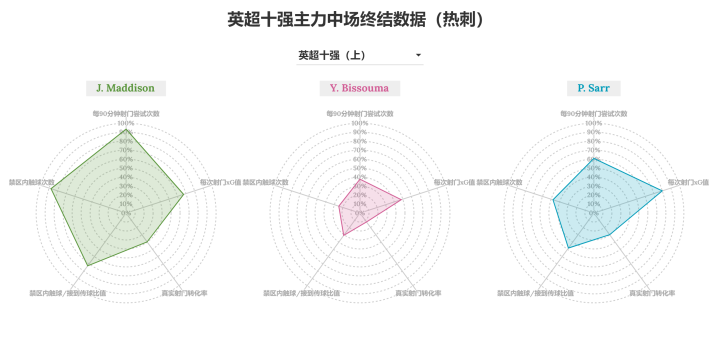
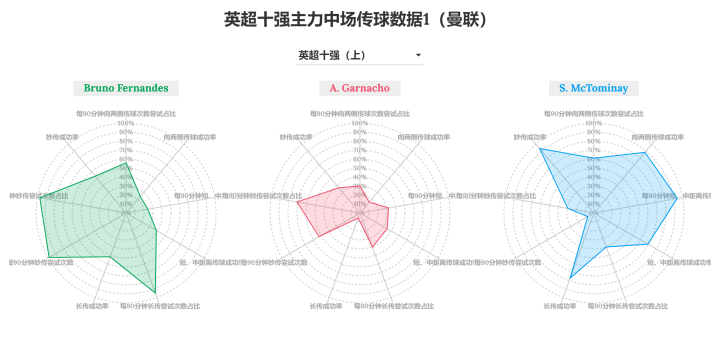
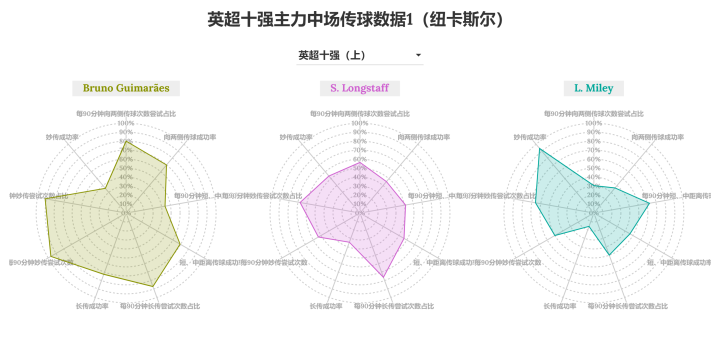
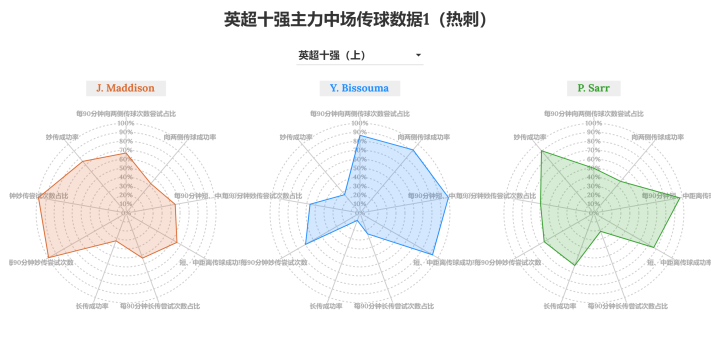
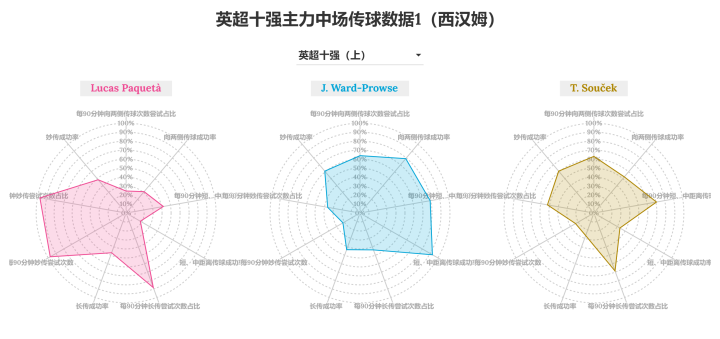
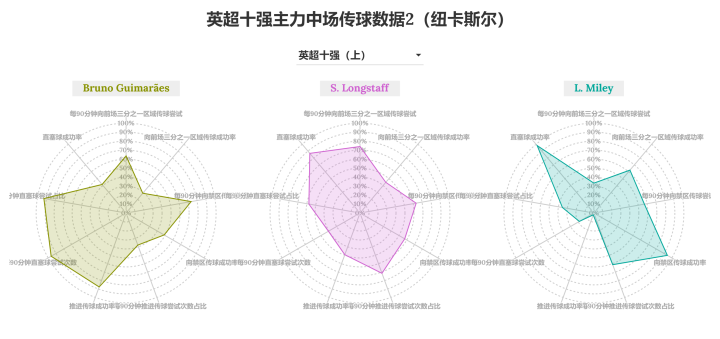
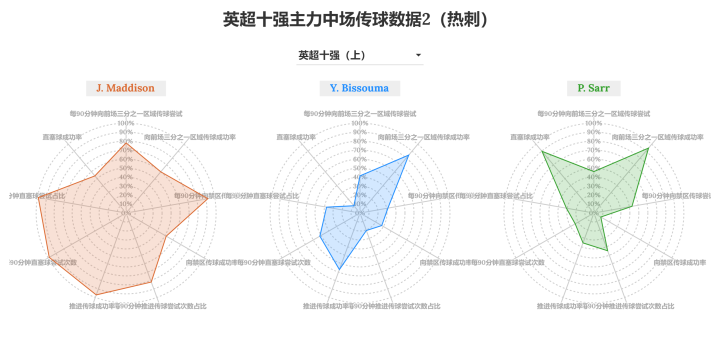
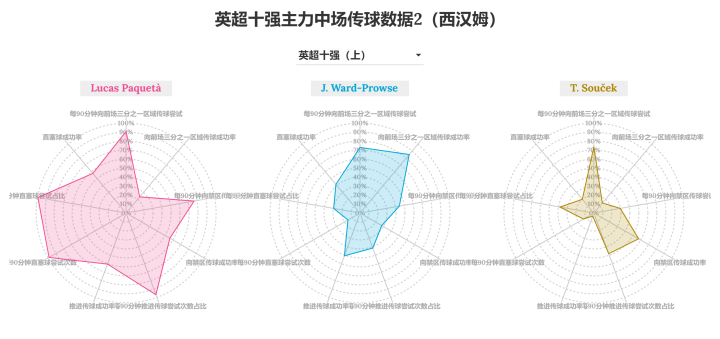
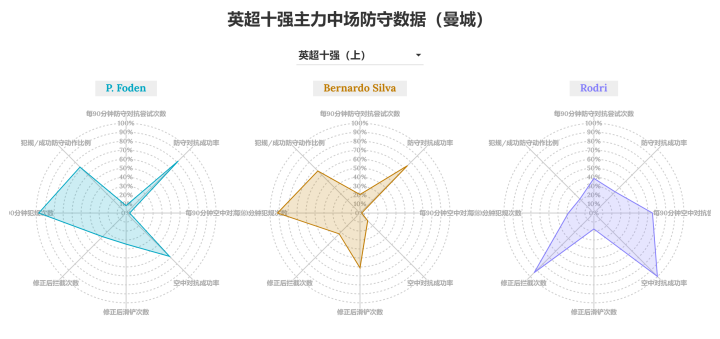
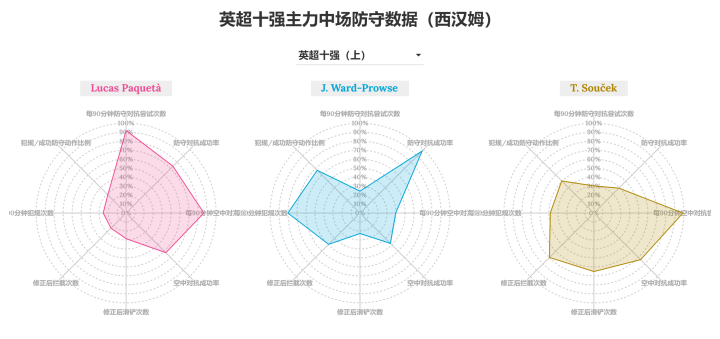
- Due to the limit of discussing only five teams at a time, I will split the analysis into two parts. This article will focus on Manchester City, Manchester United, Newcastle, Tottenham, and West Ham.
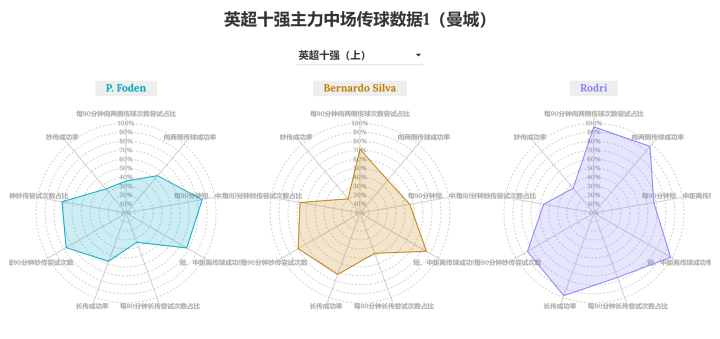
- The data dimensions include shooting, ball control, passing 1, passing 2, and defense. Why are passing indicators split into two groups? It is because Wyscout's passing data is extensive and cannot be captured in a single radar chart.
- The data is compared to players who have played at least 900 minutes in the top five leagues this season and have played in the midfield position.
- All data is ranked as a percentage. For example, if a player's shooting attempts reach the 90% mark, it means their performance surpasses 90% of the comparison group.

- Some negative data, such as fouls committed, have been ranked in reverse order.
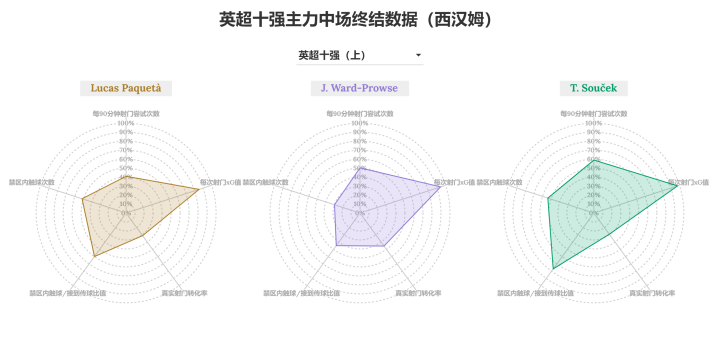
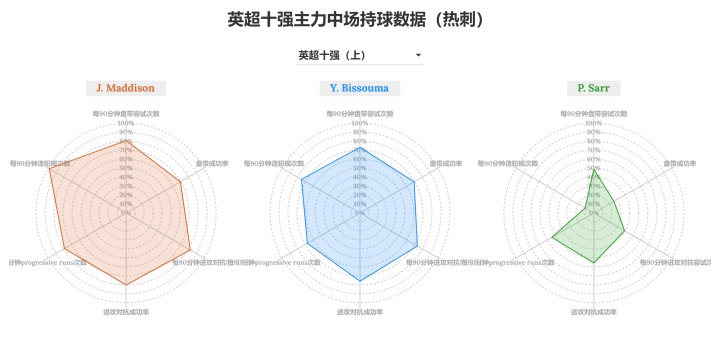
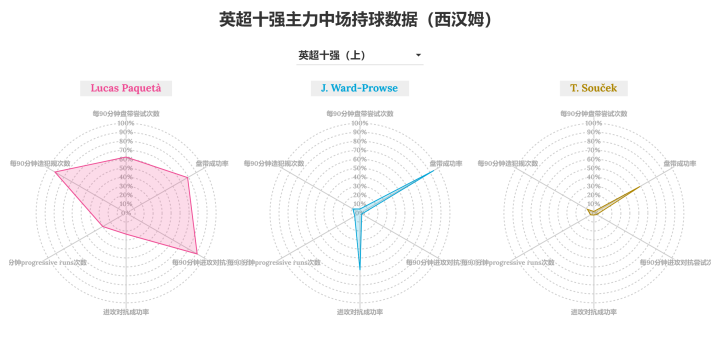
1. Shooting Data
Shooting data includes:
- Shots per 90 minutes
- Expected Goals (xG) per shot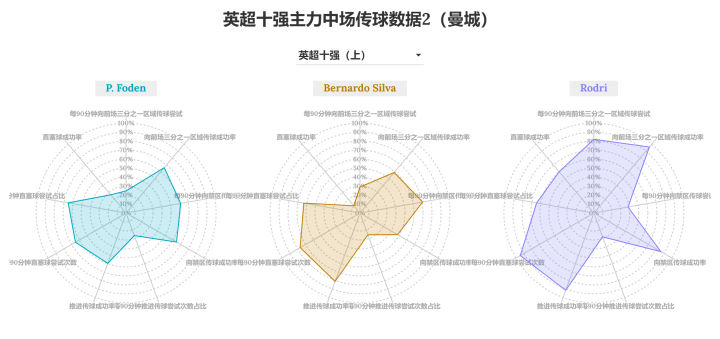

- True shooting percentage
 - Touches in opposition penalty area/received passes ratio
- Touches in the opposition penalty area.
Some key explanations for certain data:
1) Expected Goals (xG) per shot: This metric measures the quality of a player's shooting opportunities. It is influenced by both subjective and objective factors. Subjective factors refer to a player's ability to make well-timed runs, while objective factors include the player's tactical positioning and positioning within the formation.
2) True shooting percentage: This metric measures a player's shooting accuracy, calculated as "(Goals scored - Expected Goals) / Shot attempts." While this data is useful, it requires specific analysis depending on the context. One major factor that can influence this metric is the number of shot attempts. If a player has a low number of shot attempts, this metric may not accurately reflect their shooting ability. For example, if a player scores a spectacular goal but rarely takes shots afterward, their shooting percentage may appear high, even if their overall shooting ability is questionable.
相关新闻
- 德国国脚基米希回应德国广播公司调查:21%德国人希望国家队有更多白人球员
- 马斯切拉诺公布阿根廷U23备战巴黎奥运会名单
- 多特蒙德迎来欧冠300场里程碑
- 伯卡特:从伤病谷底到重返巅峰的故事
- 2023/24赛季欧冠决战:多特蒙德vs皇家马德里!
- 拉齐奥报价维罗纳前锋遭拒
- 多特蒙德VS皇家马德里:欧冠决赛即将上演
- 利物浦前球员岑登独家解读新帅斯洛特的引援目标
- 帕奎塔未被禁赛,将继续代表巴西参加美洲杯
- 西班牙国家队球员抵达基地开启欧洲杯集训
- 阿森纳加速争夺谢什科!转会交易或将近在眼前
- 红牛收购利兹联部分股权并成为新赞助商
- 皇马维尼修斯遭受种族歧视事件调查纪录遭撤销
- 尤文图斯与那不勒斯队长迪洛伦佐达成转会协议
- 皇马中卫吕迪格回忆多特蒙德青训时光